Development on Microsoft 365: Sharepoint and Power Platform

Building a time tracking solution in Microsoft 365 – Part 1

As announced we will be using our website to showcase our products and services as well as document our personal and professional research. This post is the first of a multipart series about development on Microsoft 365 and the Power Platform using Power Automate, Sharepoint Online and Power BI.

In this part we will be not be doing a lot of building and coding – we will get into more details in later parts of the series. In part 1 we will be focusing on the structure and introducing multiple parts of Office 365 and the Power Platform which we will bring together to form a functional solution.

The goal of this series: learn about developing solutions with Microsoft 365

The goal for this series is to design and build a solution to track and visualize at what time I leave home and arrive at work and vice versa. This idea has a lot of potential functional uses, such as calculating the average time of travel or correlating the average time that you arrive at work with external factors, but in the series we will focus on the technical side. We will first determine what technologies or parts of Office 365 are necessary to achieve this goal, we will plan out our design and then build our solution.

Office 365 and Power Platform; Microsoft Power Automate, Sharepoint Online Power BI

Requirements and design

The first step is of course to determine when I leave home. For this we will use a more ‘exotic’ trigger Microsoft Power Automate: Geofencing (Location). This trigger fires off whenever a phone with the Automate app installed (and the right account) leaves or enters a predefined area. We will need different triggers for dealing with Home and Work locations. We will do some calculation to determine when I leave for work or just go to the store or something. This will be done with Power Automate.

Of course this data will have to be stored somewhere. A Sharepoint Online list will be perfect for our use case. When all data is properly saved and formatted, we will make beautiful and impactful visuals with Power BI. During our building stage we will not concentrate on security, but finally at the end of this series I will give some pointers on how to start securing data with policy and built-in features of Office 365.

Technologies used

When developing solutions on Microsoft 365 you should be aware of the various technologies within Microsoft 365 that are available and their different uses. So to recap, the technologies that will be used are:

  1. Power Automate (Geofencing and calculation)
  2. Sharepoint Online (Data storage)
  3. Power BI (Visuals and functional calculations)

So let’s get started!


Microsoft Power Automate

I’m going to assume that you already know how to create a basic flow. If not, no need to worry. Microsoft has excellent online training to get started available  here.

Step 1: Create an automated flow and click “Skip” in the following screen:

Creating a new flow in Power Automate

When you click skip in the previous step you will get an option to search for the location trigger. Next, we will have to define our geofence (a virtual perimeter) in our trigger. That’s the area of interest where a trigger will fire whenever you leave or enter. There is only one trigger per flow so if we want to monitor 2 areas (home and work) we have to build an almost identical flow per location. When you have selected your trigger, click on “Edit Trigger region”. You get an interface where you can define your area by address or by dragging over the map, the latter being the most versatile. You have to experiment a bit to find the perfect balance between accuracy and functionality.


Choosing the trigger for Power Automate
Configuration of the trigger region in Power Automate

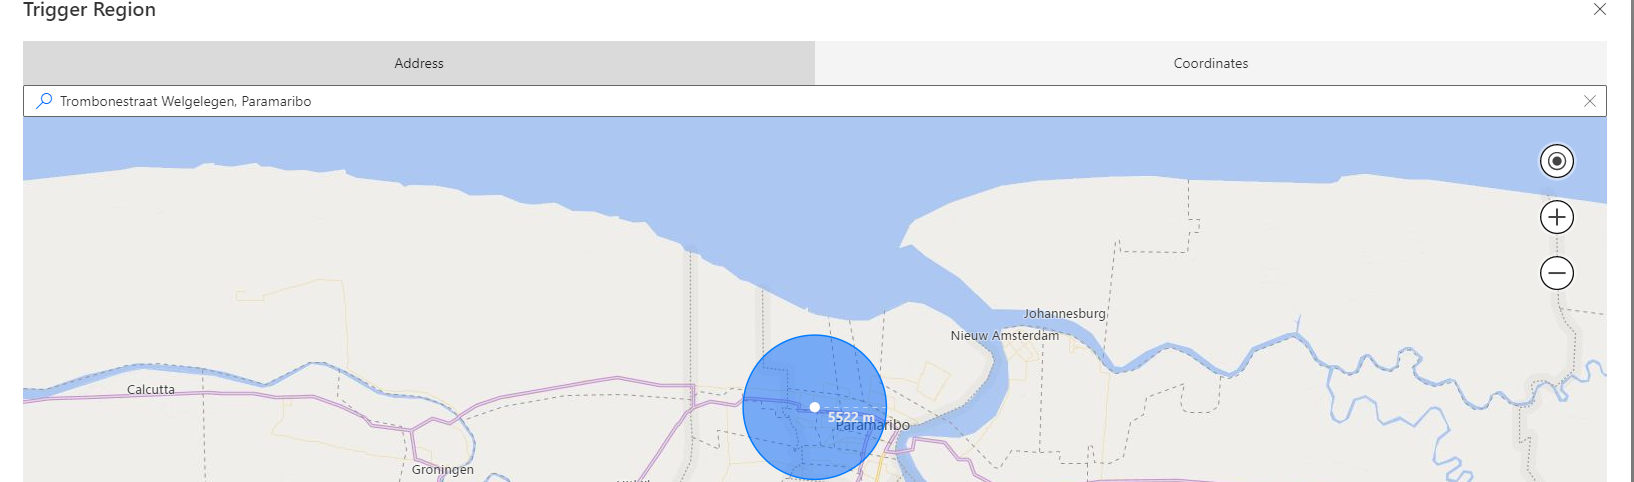
While testing we concluded that it’s better to be on the larger side to be safe to counter any negative effects of GPS inaccuracy or slow GPS lock. This worked perfectly, the first thing I did was just to send a test email when the trigger went off. But it would not be any fun to stop there. Next we will focus on storing the data.

Data storage

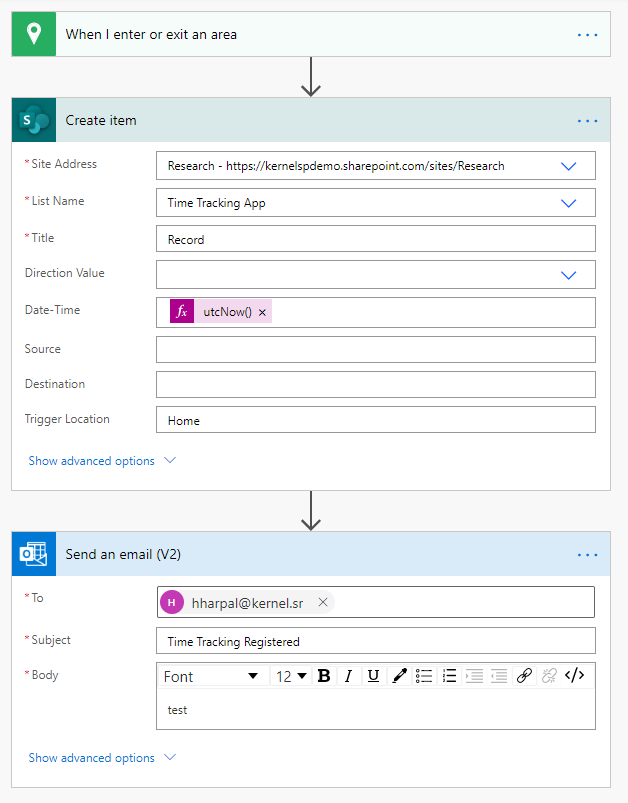
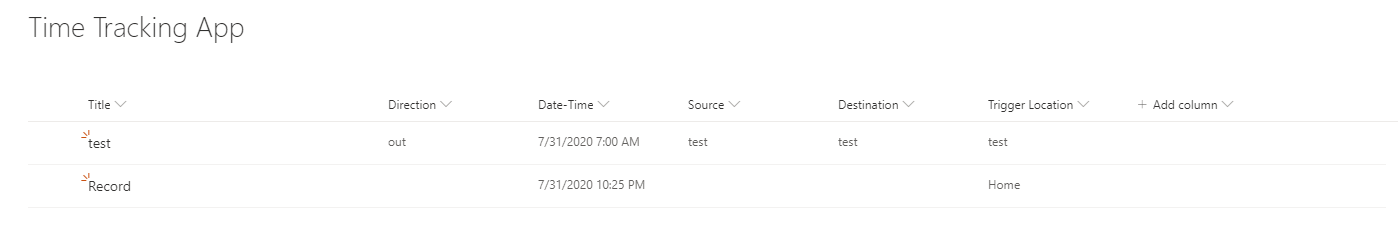
Head over to Sharepoint Online and create a list. A list in Sharepoint is a very flexible tool to store and use records. You also have the ability to add additional properties or metadata to the records and then build applications on those metadata but I’m getting ahead of myself. Let’s start with a very basic list with the properties:

  • Title (default, type: text)
  • Direction (type: Choice: out/in)
  • Date-Time (type: Date and Time)
  • Source (type: text)
  • Destination (type: text)
  • Trigger Location (type: Text)


So this list looks something like this with some test values:

With the ‘database’ in place it’s time to bring in some data through Power Automate. We will start simple:

There are some limitations with the trigger. At the moment we cannot determine if we are entering or exiting the area. The best we can do is determine where the flow triggered because we’re using 2 separate flows for Home and Work. But we will deal with that later on with some Automate magic 🙂

Result time

Let’s test and see the first results:

Success! The flow runs nicely and our record gets created.

That’s all for this post. It’s crude and unrefined but in following sections we will improve and build on this basis. We will use Automate to determine if we’re coming or going. We will also use item formatting and views to demonstrate some of the built-in intelligence and visualization tools of Sharepoint Online as well as showcase some of the versatility of Sharepoint Lists. Development on Microsoft 365 can be a fun and engaging experience. You can start very simply without completely having to know how it will look in the end but build on the blocks you assemble on the way. So stay tuned!